What does an organization supporting fisherman have in common with one that’s cleaning up a brownfields site along the Housatonic River in Great Barrington? What does a foreclosure prevention counseling program in Roxbury have in common with a small business microloan fund in the Quaboag Valley? The answer is these are all programs run by CDCs. If CDCs are this different and this varied in the services they provide and the communities they serve, is there a common theme or thread that binds them all together? Are all the CDCs operating from a same “theory of change” implicitly if not explicitly? Is there a common framework that can be developed to evaluate and measure their impact?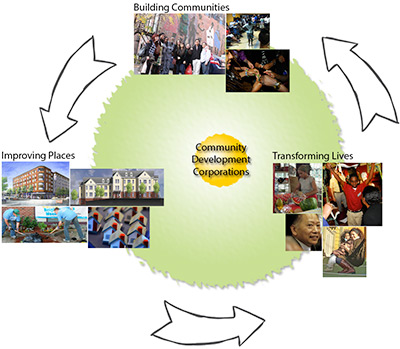
I would like to offer a tentative yes to these questions. With due respect for the individual qualities and attributes of each CDC, and with recognition that CDCs are not equal in terms of scale, capacity and impact, I do think there is a unifying theory that captures what CDCs do.
The power of the CDC model, I have come to believe, is providing a vehicle for local residents and stakeholders to initiate, implement and steward community change by fostering a virtuous and reinforcing cycle that builds the local civic culture, improves the places where we live and ultimately changes lives. Let me elaborate.
The first step is to change the way people in a community work together to create a functioning civic culture that includes everyone and allows things to get done. In many places, each constituency has just enough power to stop things, but none have enough power to get things done on their own. This can lead to gridlock. Effective CDCs help people in the public, private and nonprofit sector work together. They also help address another common problem in the civic life of many communities – the fact that certain groups in the community are not always at the table – lower income people, new comers, linguistic minorities, youth and disabled people are generally less likely to be engaged unless there is an intentional effort made to include them.
As communities begin to come together, the physical environment in a neighborhood or community can begin to change. New housing, businesses, jobs, parks, and infrastructure can provide residents with the stability, safety and access to opportunities that they need to improve their lives. CDCs have the technical, financial and yes, the political capacity to undertake, and/or spur others to undertake, the complex development projects that are needed to create and sustain effective local economies, while also creating safer and healthier environments for local residents. Often, CDCs are able to drive a series of development projects over a period of years to completely transform a neighborhood.
As these neighborhoods improve, people can begin to change their life trajectories. Stable housing enables adults to better compete for jobs or obtain the job training they need. Students with a stable home do better in school and have the ability to pursue their dreams and talents. Safer streets, improved community facilities and new businesses bring new opportunities to local residents. CDCs often complement their placed based work with a wide variety of programs designed to help residents enter the economic mainstream and connect to the regional economy. These programs can include financial education and savings programs, homebuying classes, foreclosure counseling, ESOL and youth programming. As these efforts help to stabilize people’s lives and they gain entry to the economic mainstream, they are better able to participate in the civic life of their communities. Time and again, we see participants in CDC programs become leaders in their communities, helping to pay it forward for the next family that needs help. And the cycle begins anew.
This approach is validated by the experience of practitioners across the country. More and more academic research is also coming out that documents the ways that improved neighborhoods, stable housing and economic security produce positive outcomes in public heath, educational attainment, public safety, and environmental sustainability. Policy makers at the state and federal level are recognizing these linkages in new programs like Choice Neighborhoods and Promise Neighborhoods at the federal level and the Community Investment Tax Credit recently enacted in Massachusetts. Going forward, we need to improve our ability to collect meaningful data and evidence that allows us to evaluate the efficacy of this approach, refine our models, build our capacity, and tell the story of our field so we can obtain the resources we need to scale our impact.


